Boards
Overview
Boards in Veezoo are custom dashboards that display selected data insights through various types of visualizations. They provide a structured and interactive view of your data, which is particularly useful for monitoring key metrics, performing high-level data analysis, and presenting data insights.
A board can be created over the Chat UI or defined through a board declaration containing one or more widgets. Each widget represents a data insight.
qb {
    board Sales_Analysis {
        name.en: "Sales Analysis"

        for_user_role: "Sales Manager"

        widget Revenue_Overview {
            name.en: "Revenue per Category"

            board_row: 0
            board_column: 0

            height: 3
            width: 6

            vql: """
              var order: kb.Order

              var category = order.with_Product.Category
              select(category, sum(order.Sales) by (category))
            """
            visualization: BarChart
        }

        widget Sales_Trends {
            name.en: "Sales Trends"

            board_row: 0
            board_column: 6

            height: 3
            width: 6

            vql: """
              var month = periodicity("P1M")
              var order: kb.Order

              var orderDate = order.Order_Date
              project_date(orderDate, month)
              date_in(orderDate, dynamic_date("this year", "en"))
              select(month, sum(order.Sales) by (month))
            """
            visualization: LineChart
        }
    }
}
Advantages of defining as VKL code
By defining it as VKL code, you can:
- collaborate more easily with other team members
- have it version controlled
- easily share it across tenants in a multi-tenant / embedded setup
- have the board available in development branches
- ask questions about the board in the Chat UI via the board name
- see in one view how it is defined
How to create it
To create a board, you have two options:
Option 1 - Chat UI (recommended)
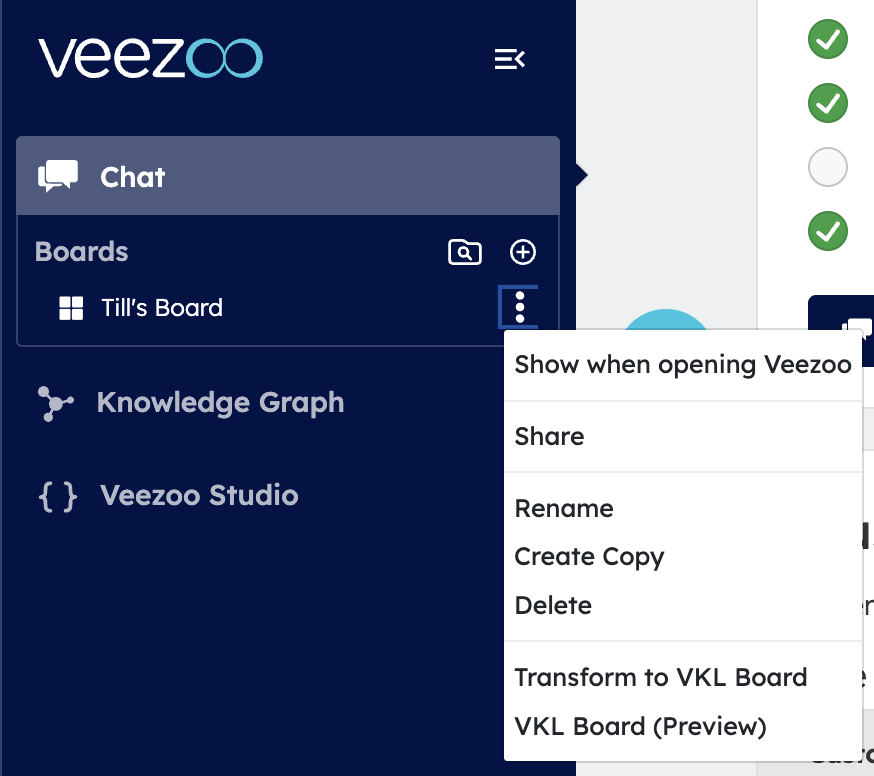
Creator users can transform an existing board into VKL by clicking on the "Transform to VKL Board" button in the board's dropdown menu. Before doing so, you can check the VKL code that will be generated by clicking on VKL Board (Preview).
Option 2 - Directly in Studio
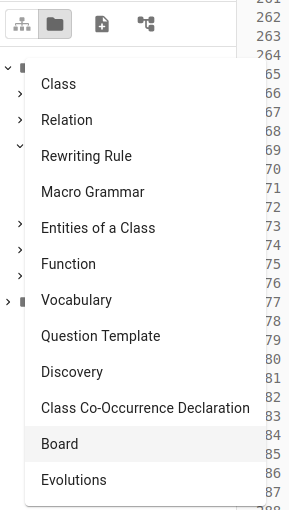
Open Studio and click to create a new Board file in the Sidebar. When the modal appears, give it a name, e.g. My Board.
VKL Structure
Here's a brief overview of the structure of the VKL file with the Board definition:
board: The highest level of grouping in the board. Each board contains several widgets.widget: Each widget represents a data insight displayed in a specific visualization format.
Each of these elements has several properties:
board
name: The name of the board, displayed to the users.for_user_role: (Optional) A user role with which the board is shared. If not set, the board is shared with all users.
Depending on whether for_user_role is set, VKL boards are shared with a given list of roles or the whole organization. In both cases, they are added to all users' sidebars by default. See here for more details about shared boards.
widget
name: The name of the widget, displayed to the users.board_row: The row number where the widget is displayed on the board.board_column: The column number where the widget is displayed on the board. Defined between 1 and 12.height: The height of the widget.width: The width of the widget, between 1 and 12.vql: The VQL query that defines the widget.visualization: (Optional) The type of visualization used to display the data insight.visualization_options: (Optional) The JSON visualization options used in a widget. It is recommended to let it be generated via 'Modify Visualization' in the frontend.swap_dimensions: (Optional) Whether the dimensions in the chosen visualization (if supported) should be swapped.
visualization
This is the type of visualization used to display the data insight. You can set this for every widget. If unset, Veezoo chooses the most appropriate visualization. You can choose from a number of available charts:
AreaChart
MultiAreaChart
StackedAreaChart
PercentStackedAreaChart
BarChart
MultiBarChart
StackedBarChart
PercentStackedBarChart
ColumnChart
MultiColumnChart
DrillDownColumnChart
MultiDrillDownColumnChart
StackedColumnChart
PercentStackedColumnChart
PieChart
DrillDownPieChart
LineChart
MultiLineChart
MultiAxesLineChart
RangeMultiLineChart
BubbleChart
MultiBubbleChart
LabeledMultiBubbleChart
ScatterChart
MultiScatterChart
LabeledMultiScatterChart
TreeMap
ChoroplethMap
HeatMatrixChart
TableChart
SimpleNumberChart
TwoNumberChart
NumberComparisonChart
HistogramChart
MultiAxesBarCategoricalChart
MultiAxesColumnCategoricalChart
MultiAxesColumnChart
MultiAxesLineColumnChart
OrderedCategoricalsMultiLineChart
TopColumnChart
VeezooMapChart