Modify Visualizations
When Veezoo displays an answer in the chat, you can modify most visualizations by two means:
- By interacting with an LLM model abd issuing modification requests in natural language
- By manually editing a visualization's options as a JSON object
The following steps show how to modify a visualization:
- Ask a question
- In the answer, click on the Change Visualization button and choose your desired visualization
- Click again on the Change Visualization and choose Modify Visualization
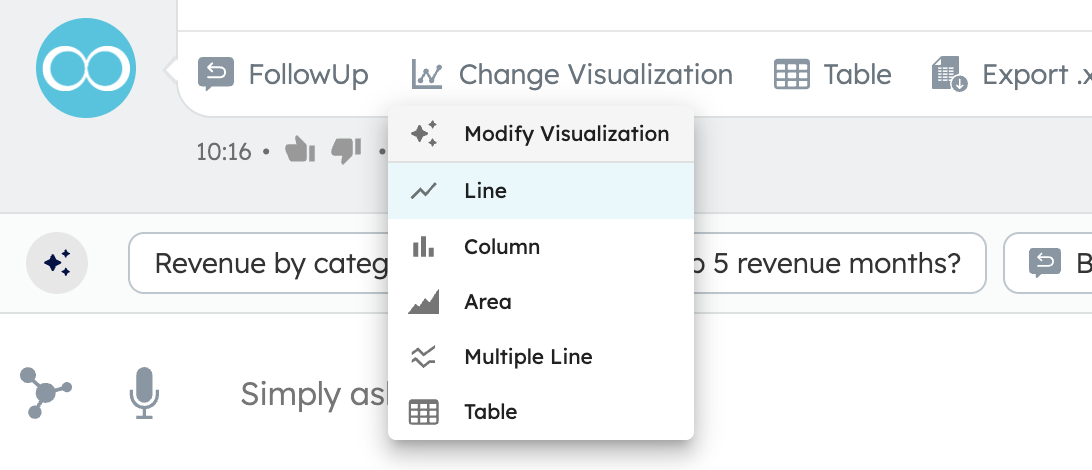
- A text field appears below the visualization where you can enter and submit modification requests to adapt the visualization to your liking
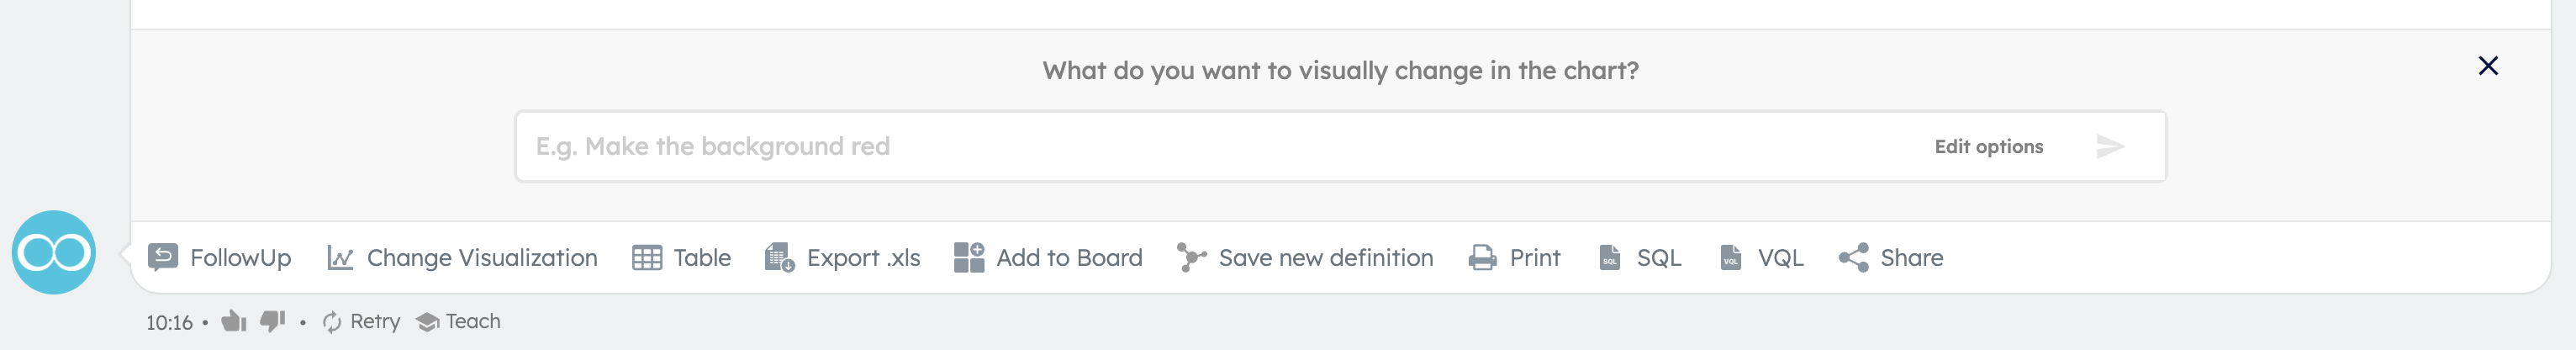
- Use the Edit options button inside the text field to make manual adjustments to the visualization's options
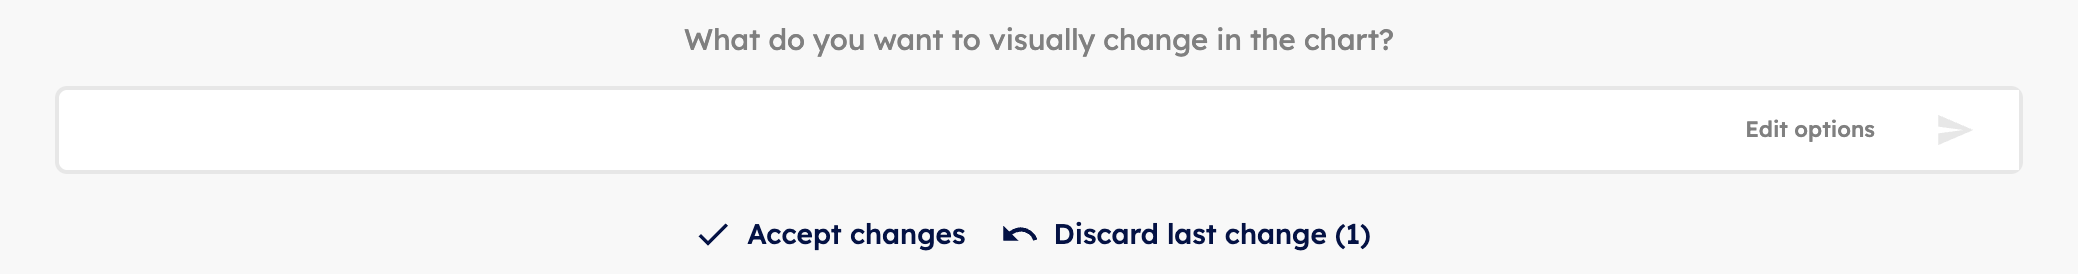
- You can always discard the last modification by going back to the previous state. Once satisfied, you can accept the changes
When you save an answer as a widget in a board or share and answer via link, any modifications you have done to the visualization are persisted. They can also be further improved or undone at a later point.
Charts
Chart Example
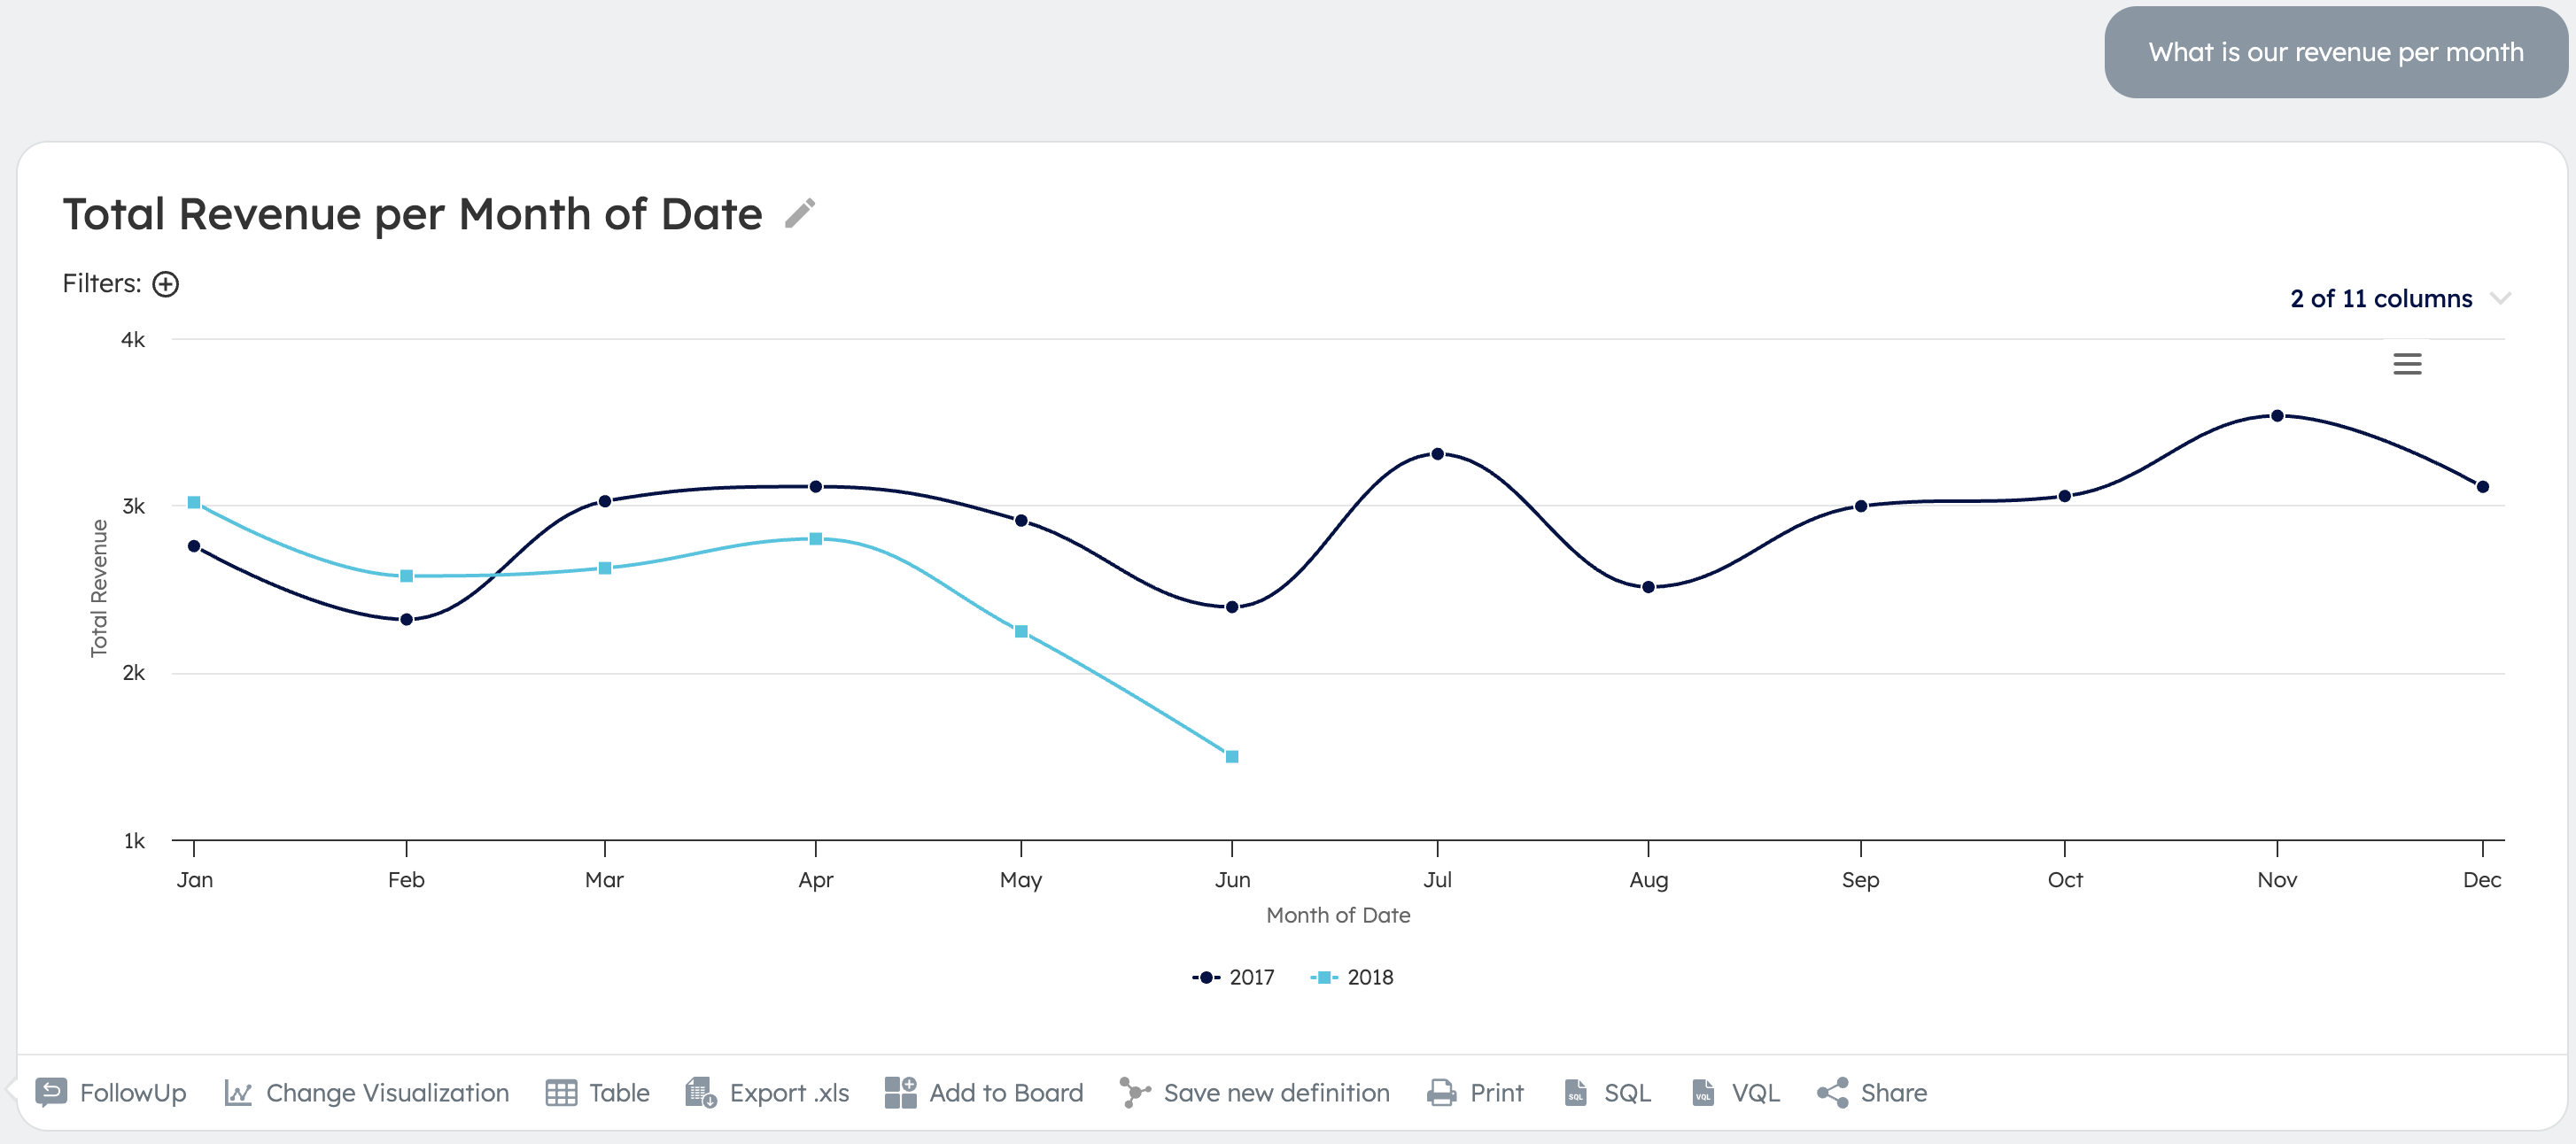
The following shows an example of what a modification of a chart visualization might look like:
- Before:
- Prompts:
- "add a green target line at 3.75k"
- "make the lines red"
- After:
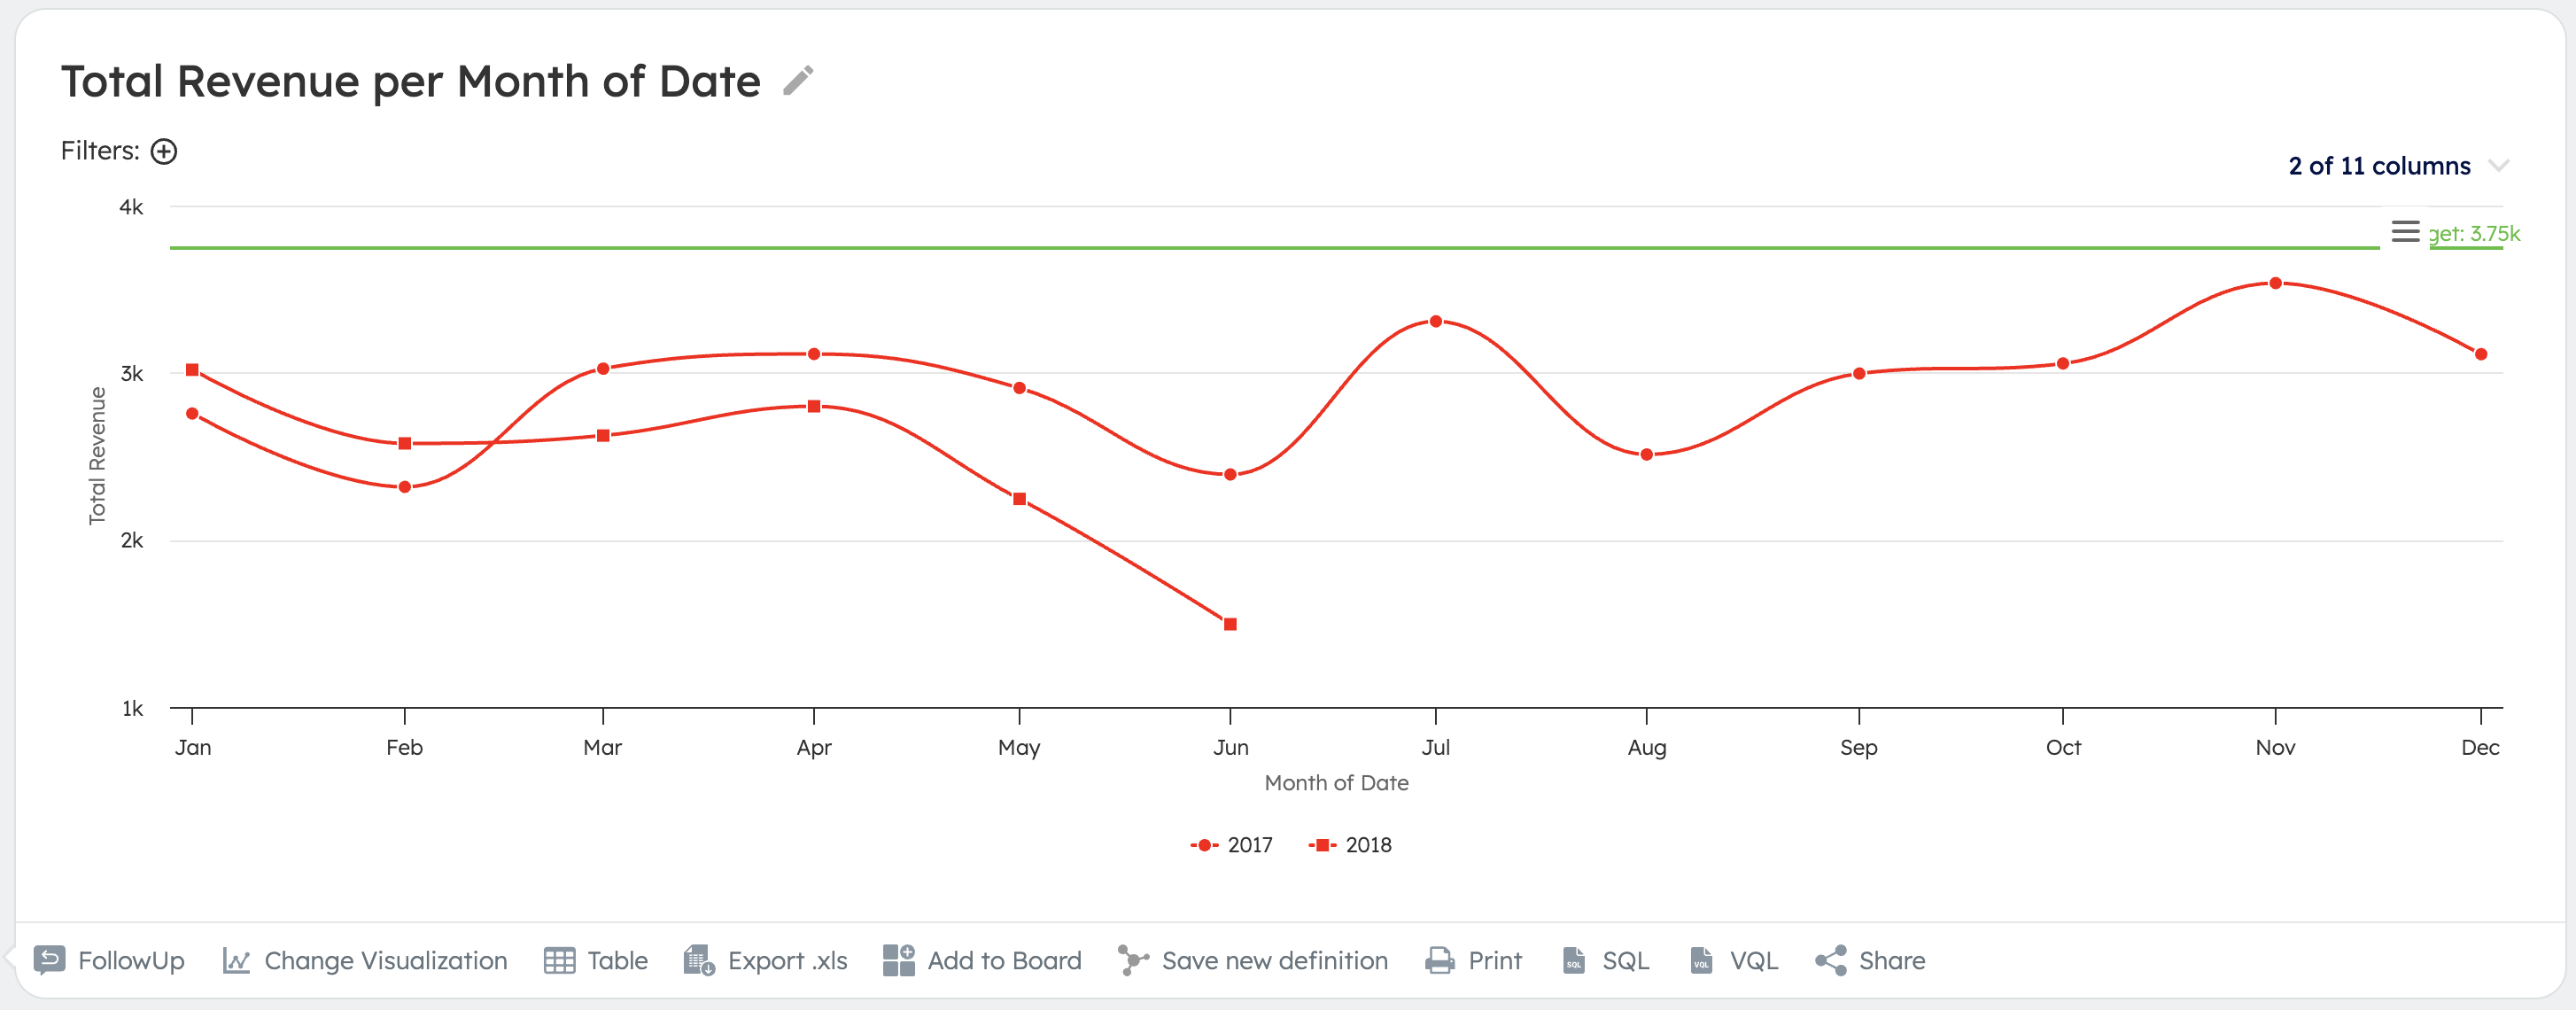
Chart Options
The chart visualizations are based on the Highcharts library. Their options are documented on the following page:
https://api.highcharts.com/highcharts/plotOptions
Tables
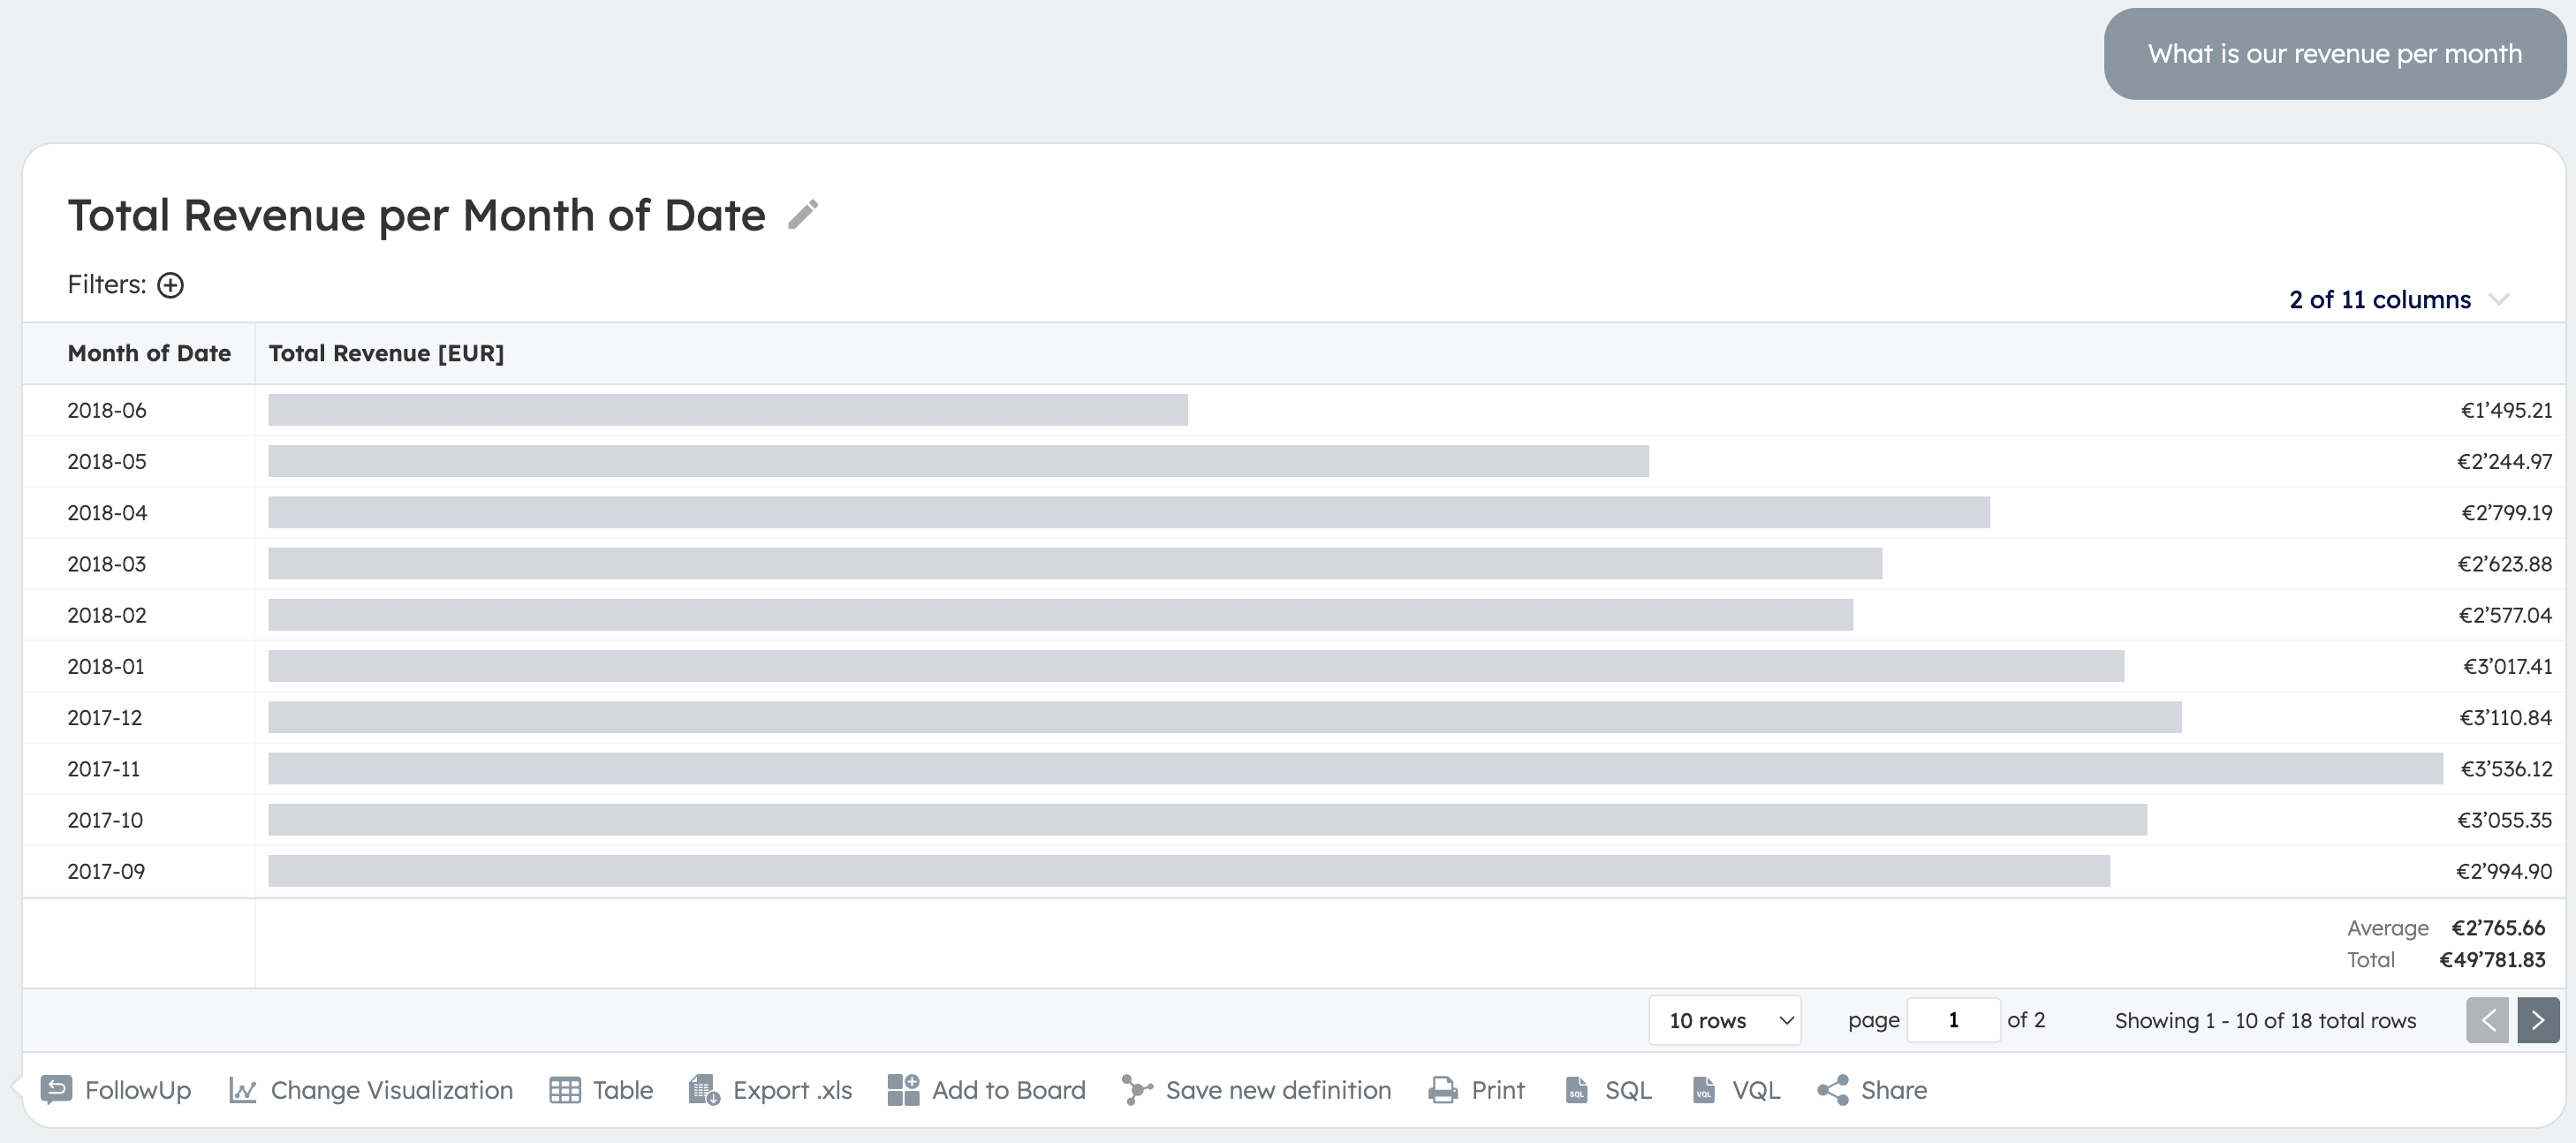
The following shows an example of what a modification of a table visualization might look like:
Table Example
- Before:
- Prompts:
- "make the revenue cells a green heat map"
- "remove the bars"
- "format the dates like June 2018 etc"
- After:
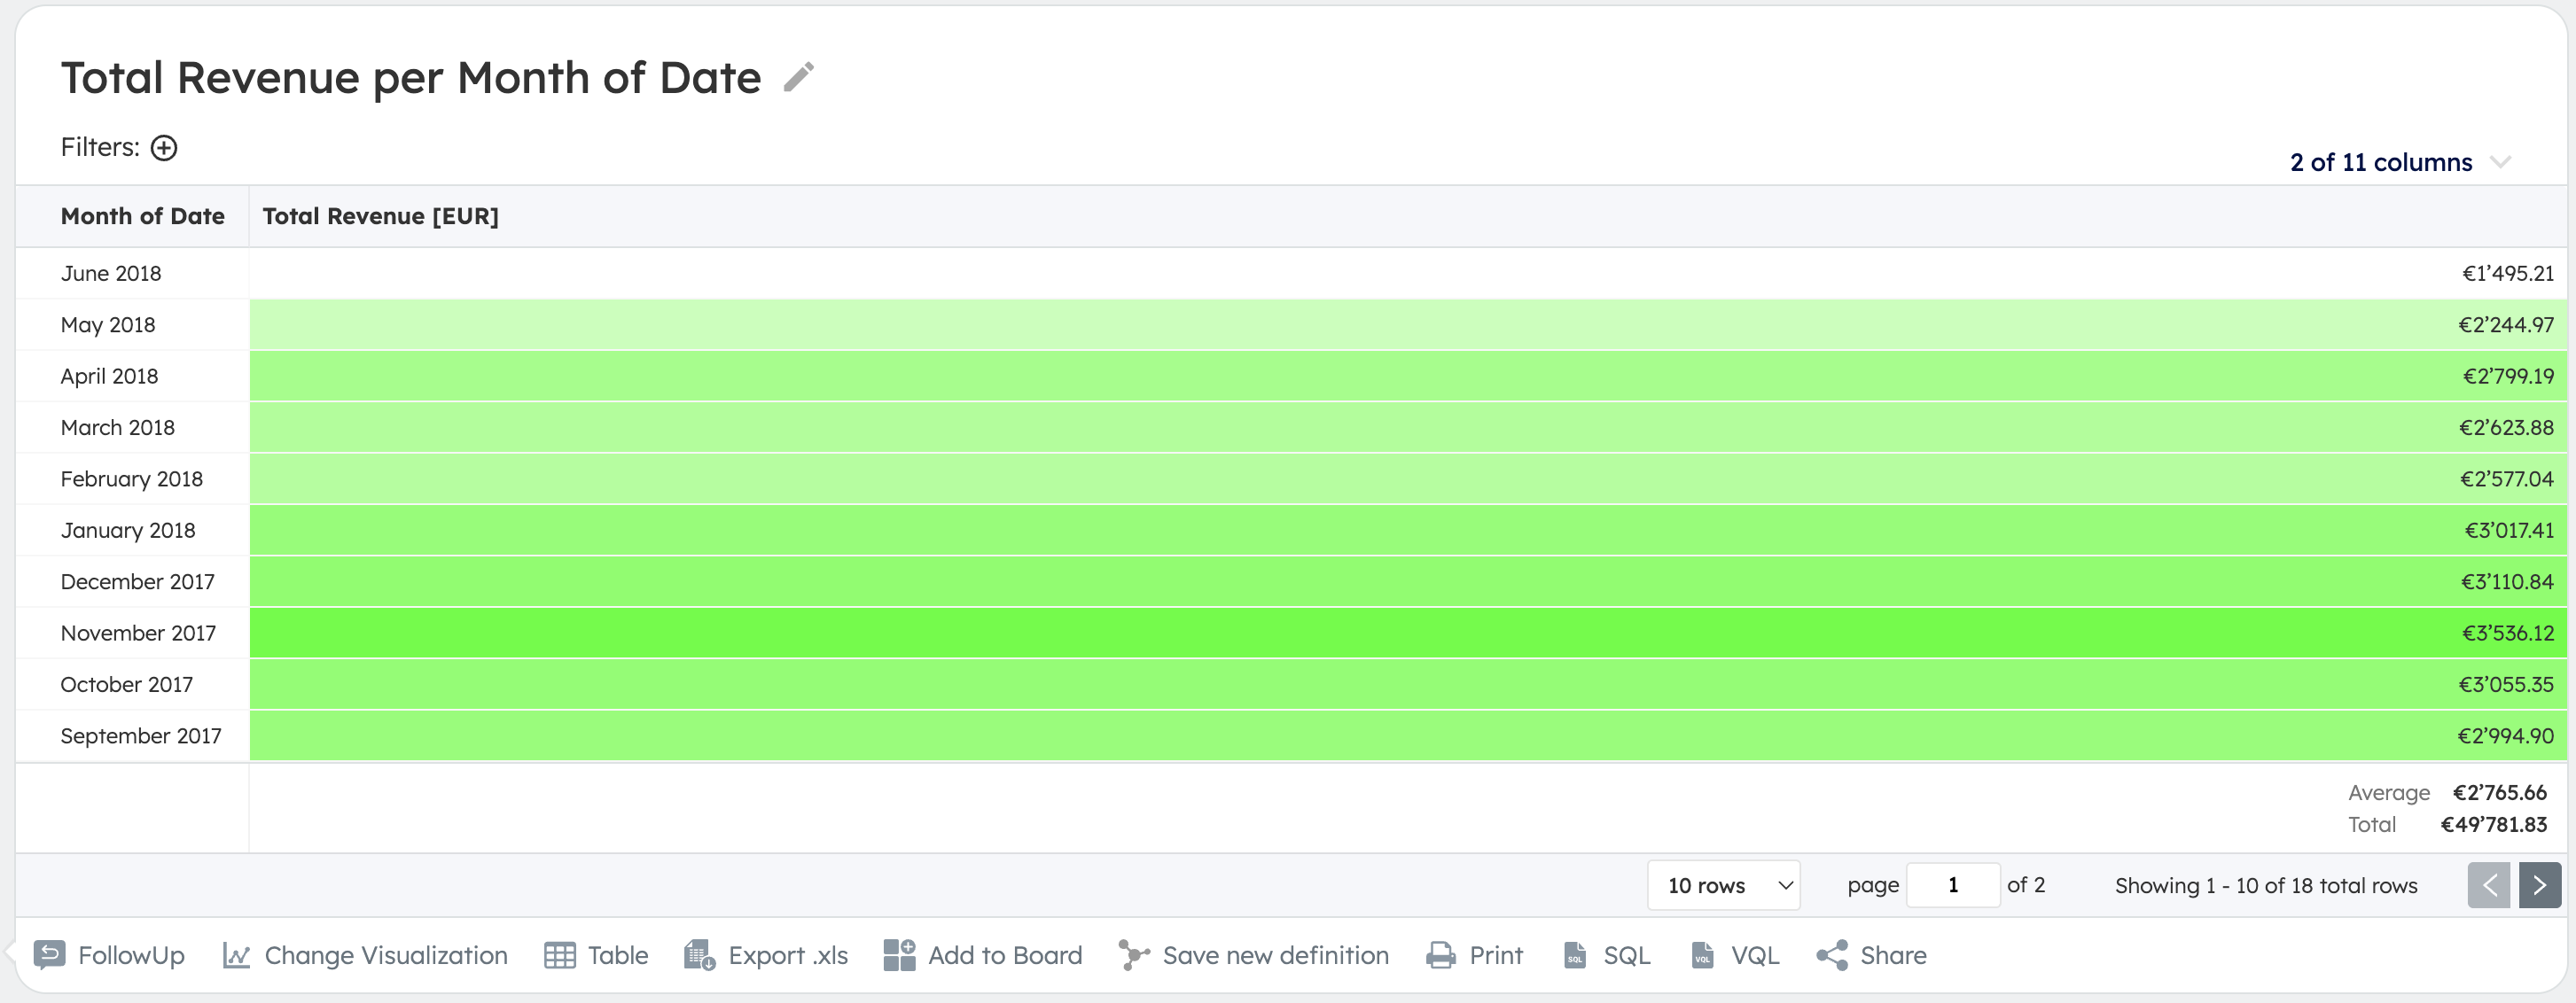
Table Options
The table visualizations are based on the following proprietary configuration format:
| Property | Description |
|---|---|
columns | The ordered list of columns |
columns[*].id | The identifier of the column (cannot be changed) |
columns[*].type | The type of the column, such as number, string, datetime, categorical etc. (cannot be changed) |
columns[*].title | The title of the column |
columns[*].htmlTemplate | The Liquid HTML template defining how the column's values are rendered |
columns[*].cellBackgroundColorTemplate | The Liquid template defining the CSS background-color property of the column's table cells |
columns[*].isHidden | Specifies whether the column is hidden |
columns[*].disableBars | Specifies whether to disable (hide) the bars (with width correlating to the cell value) rendered by default in cells of number columns |
columns[*].disableStatisticsFooter | Specifies whether to disable (hide) the column footer containing statistics (e.g. average and total) rendered by default for number columns |